Running
Start Scalr
As "one shot" meant to be used as cron job execution:
Note
One shot execution does not provide Prometheus metrics.
As daemon:
Docker
We provide docker images as ghcr.io/ngine-io/scalr:latest.
A minimal docker compose file would look like:
---
version: "3.9"
services:
  scalr:
    image: ghcr.io/ngine-io/scalr:latest
    ports:
      - "8000:8000"
    command: --periodic
    environment:
      - SCALR_INTERVAL=60
      - SCALR_LOG_LEVEL=INFO
      - SCALR_CONFIG=/app/config.yml
      - SCALR_PROMETHEUS_EXPORTER_PORT=8000
      - VULTR_API_KEY=...
    volumes:
      - "./config.yml:/app/config.yml:ro"
Monitoring
Hint
Exporter port can be changed SCALR_PROMETHEUS_EXPORTER_PORT. Default is 8000.
Scalr running in --periodic exports Prometheus metrics, such as:
# HELP python_gc_objects_collected_total Objects collected during gc
# TYPE python_gc_objects_collected_total counter
python_gc_objects_collected_total{generation="0"} 37145.0
python_gc_objects_collected_total{generation="1"} 6512.0
python_gc_objects_collected_total{generation="2"} 687.0
# HELP python_gc_objects_uncollectable_total Uncollectable object found during GC
# TYPE python_gc_objects_uncollectable_total counter
python_gc_objects_uncollectable_total{generation="0"} 0.0
python_gc_objects_uncollectable_total{generation="1"} 0.0
python_gc_objects_uncollectable_total{generation="2"} 0.0
# HELP python_gc_collections_total Number of times this generation was collected
# TYPE python_gc_collections_total counter
python_gc_collections_total{generation="0"} 234.0
python_gc_collections_total{generation="1"} 21.0
python_gc_collections_total{generation="2"} 1.0
# HELP python_info Python platform information
# TYPE python_info gauge
python_info{implementation="CPython",major="3",minor="8",patchlevel="10",version="3.8.10"} 1.0
# HELP process_virtual_memory_bytes Virtual memory size in bytes.
# TYPE process_virtual_memory_bytes gauge
process_virtual_memory_bytes 6.71674368e+08
# HELP process_resident_memory_bytes Resident memory size in bytes.
# TYPE process_resident_memory_bytes gauge
process_resident_memory_bytes 8.3685376e+07
# HELP process_start_time_seconds Start time of the process since unix epoch in seconds.
# TYPE process_start_time_seconds gauge
process_start_time_seconds 1.64899542198e+09
# HELP process_cpu_seconds_total Total user and system CPU time spent in seconds.
# TYPE process_cpu_seconds_total counter
process_cpu_seconds_total 157.28
# HELP process_open_fds Number of open file descriptors.
# TYPE process_open_fds gauge
process_open_fds 32.0
# HELP process_max_fds Maximum number of open file descriptors.
# TYPE process_max_fds gauge
process_max_fds 8192.0
# HELP scalr_min Min amount of resources
# TYPE scalr_min gauge
scalr_min 1.0
# HELP scalr_max Max amount of resources
# TYPE scalr_max gauge
scalr_max 5.0
# HELP scalr_factor Calculated factor of policies
# TYPE scalr_factor gauge
scalr_factor 5.0
# HELP scalr_desired Desired amount of resources
# TYPE scalr_desired gauge
scalr_desired 5.0
# HELP scalr_current Current amount of resources
# TYPE scalr_current gauge
scalr_current 5.0
# HELP scalr_max_step_down Max step for scaling down
# TYPE scalr_max_step_down gauge
scalr_max_step_down 1.0
# HELP scalr_cooldown_timeout Timeout in seconds after scaling actions
# TYPE scalr_cooldown_timeout gauge
scalr_cooldown_timeout 300.0
# HELP scalr_dry_run Dry run mode
# TYPE scalr_dry_run gauge
scalr_dry_run{scalr_dry_run="on"} 0.0
scalr_dry_run{scalr_dry_run="off"} 1.0
# HELP scalr_enabled Scaling enabled
# TYPE scalr_enabled gauge
scalr_enabled{scalr_enabled="yes"} 1.0
scalr_enabled{scalr_enabled="no"} 0.0
Prometheus Scrape Config
scrape_configs:
- job_name: scalr
  metrics_path: /
  scrape_interval: 5s
  static_configs:
    - targets:
      - scalr-app:8000
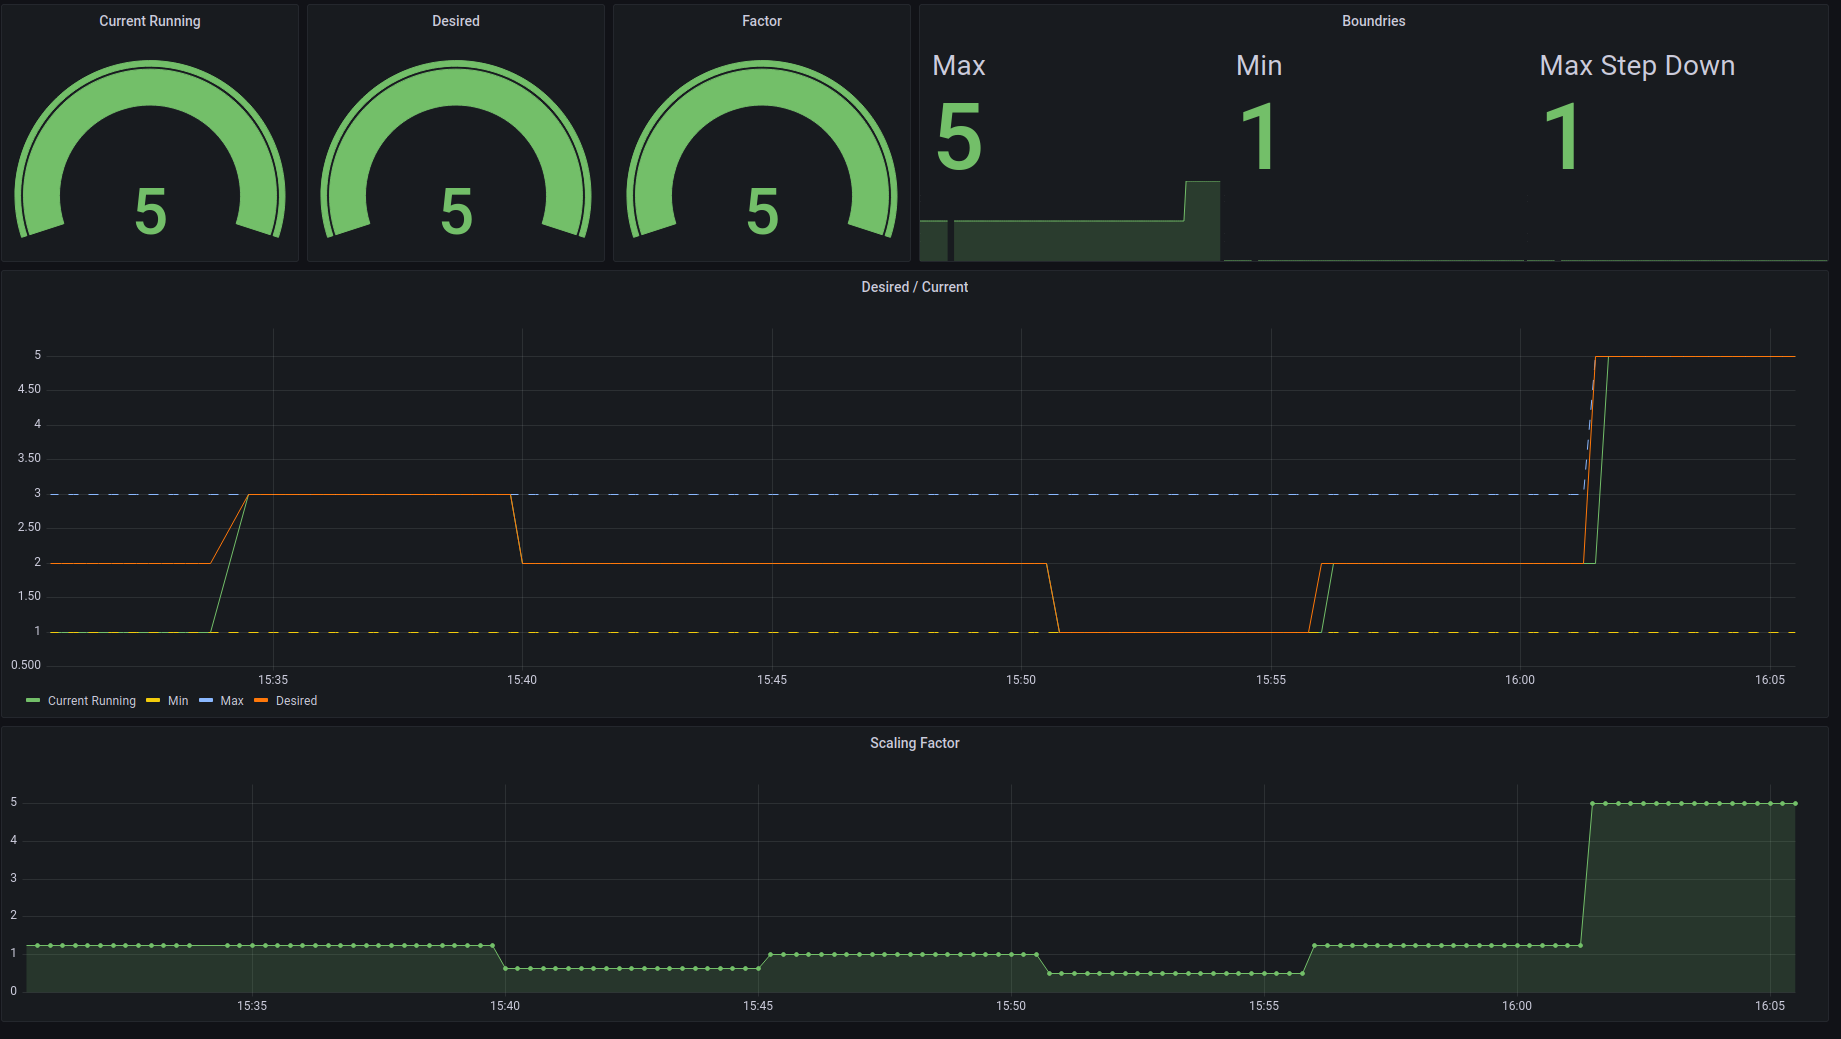
Grafana Dashboard
A simple dashboard for scalr can be found on Github